High Yield Check-in: What the Analytics Say

December 30th, 2016

A year ago, in the midst of severe distress in High Yield fixed income, a research bulletin was published for subscribers titled “Seven Salient Thoughts on High Yield Now” (December 17, 2015) whereby we outlined the following assessment:

  • High Yield distress was primarily attributed to investor fear of oil-related defaults.
  • Oil prices (and those of high yield debt) were oversold.
  • When oil prices retraced back toward equilibrium, High Yield would see a snap-back rally.

Indeed, the High Yield sell-off bottomed on the same day as oil prices on February 11th. Currently, at the close of 2016, the median Morningstar High Yield fund is up more than 13%.

But what is to be expected now? Can the run still continue?  The summary below offers a quick example at how analytics can help drive allocation decisions.

Examining Periods with Low Spreads

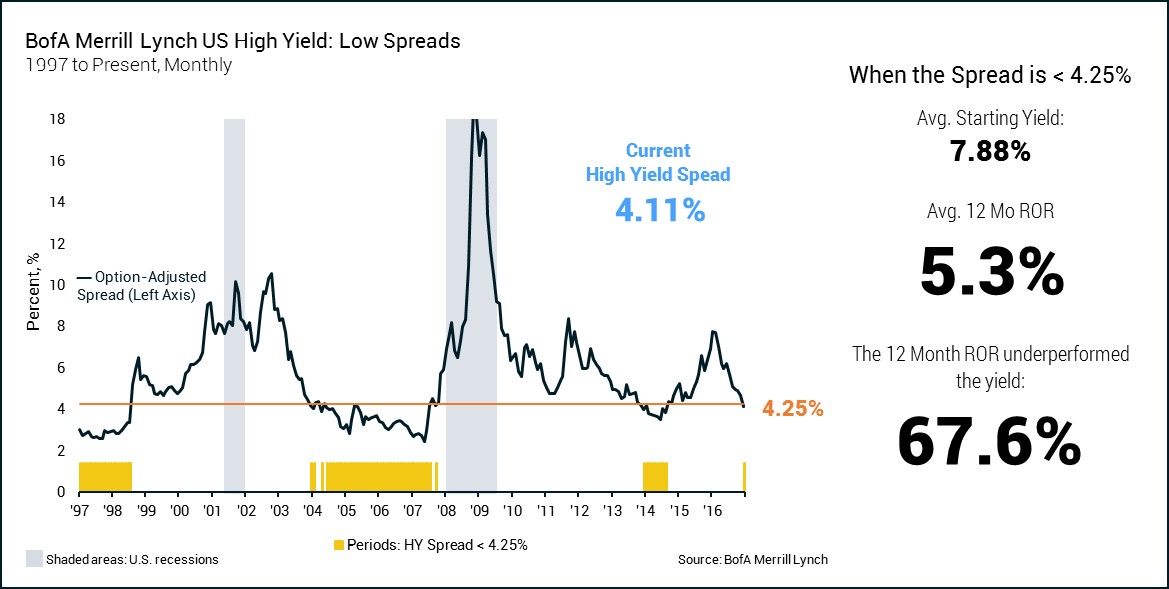
The present rally has pushed spreads (BofA Merrill Lynch US High Yield Option-Adjusted Spread) back down to low levels not seen since 2014. When looking at periods with similarly low spreads (<4.25%), here is what the data says:

  • Periods of low spreads (marked by the yellow periods) are not that uncommon, making up 29% of the time over the last 20 years.
  • Nonetheless, the average 12 month return is only 5.3%. While that may seem satisfactory at first, remember some important points. First, it’s actually less than the average starting yield, meaning the return under-performed the yield investors were hoping to attain. Secondly, it is without a packaged fund expenses which would also bring down the realized return.


How Cycle Staging Can Contribute to the Assessment

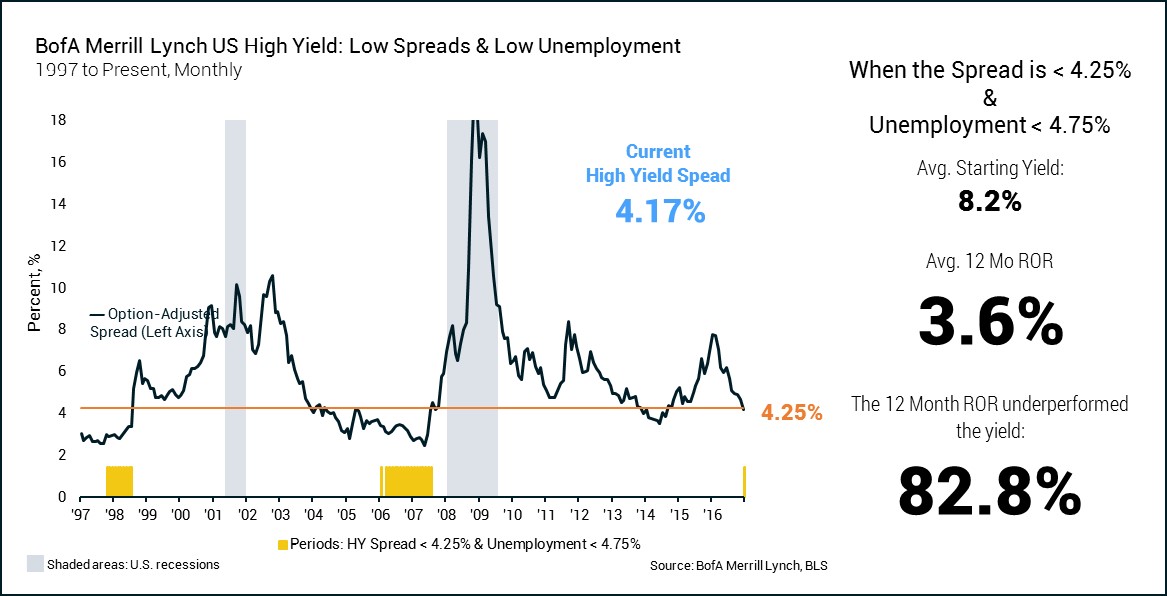
Adding a second criteria where the examination looks only at those periods with low spreads and low unemployment (at < 4.75%, it serves as a proxy for late cycle staging) further develops the outlook for High Yield.

  • Periods meeting both criteria are much less common, making up only 11% of the 20-year snapshot.
  • When considering late stage investing, the average return worsens (as expected), producing a 3.6% 12 month return.
  • The 3.6% return certainly doesn’t compensate investors for the perceived risk they take when investing in High Yield, nor does it meet the desired target return when serving as an anchor to an income based portfolio.


What to Conclude from the Analytics

Combining business cycle staging, historical asset class performance, and sound analytics, offers a deeper understanding of the evolving risk/reward profile of High Yield fixed income. Unfortunately, present circumstances show High Yield with diminishing upside potential and an expanding downside. This evolving outlook warrants caution for investors in 2017 and a close reexamination of expectations. At a minimum, investors would be wise to avoid untimely over-weighting an asset class after its’ driving forces have dissipated.

Of course, proper analytics does require acknowledging that a poor return isn’t imminent. There have been occasions upon which spreads started low in the late stage and attractive returns still followed.  In order for this to occur, corporate lending distress must recede further and investors must be willing to pay higher prices for a lower overall effective yield. While not completely out of the range of possibilities, each of these events become less likely as the expansion matures.

Christopher Riggs, J.D., CFP®, is the President of Alphalytics Research. To learn more about Alphalytics Research or the Economic Systemic Risk Index, please contact us at [email protected].

Amanda Adams
Fitness Expert
Lorem ipsum dolor sit amet, consectetur adipisicing elit. Totam assumenda, placeat ad. Consequatur ipsa asperiores corporis doloremque, dolore nihil blanditiis temporibus provident perspiciatis, iste officia voluptates nulla, ex veritatis harum.

Trump Triumphs… Now What?

November 9th, 2016

What was considered nearly impossible on the start of election day happened last night as the U.S. electorate voted Washington outsider and businessman, Donald Trump, to become the 45th president of the United States. Investors now must wrap their minds around this previously unforeseen outcome. Here is our quick headline analysis.

1. Don’t panic, instead think opportunistically.

It’s a simple fact: markets react to major unexpected events. However, history also tells us that knee-jerk panic reactions more often than not lead to seller’s remorse. Despite certain pockets of despair from last night, the sun is up today and commerce is moving forward. If markets descend irrationally, think opportunistically.

2. Markets didn’t bet on a Clinton victory, so no major retracement is necessary.

Even though the mass media was moving with certainty of a Clinton victory, markets were clearly not! In the months leading up to the election markets were nearly frozen in uncertainty. Since July 31st, the S&P 500 total return index was only down about 1%, while volatility flattened.

This was in stark contrast to the Brexit vote where the European stock index was up over 8% in the eight days preceding the referendum. In essence, US market participants have been hedging an outcome in either direction and no great retracement is needed based on the surprise outcome.

3. The economy matters more!

In the spirit of James Carville, former strategist for the 1992 Clinton campaign, “It’s the economy, stupid!” Time has proven the economy matters more than surprise events. When cooler heads prevail, intelligent investors will find the economy growing at an improving pace and corporate earnings on an improving trajectory.  If a pullback occurs, there are many investors that will find it an attractive time to buy, and thus, making it short-lived.

4. When it comes to policy, Trump offers a bullish case.

With a Republican sweep, we now see the chance for campaign rhetoric to become reality. At the top of the list is corporate tax reform. Next, would be infrastructure spending. Both ideas carried weight during the campaign, but these bullish reforms can’t come soon enough. If passed quickly, it could supply an important stimulus to a long and maturing expansion.

5. Trump’s victory raises uncertainty at the Fed.

The election of Trump could be perceived as a mandate to clean up a government that has exceeded its proper boundaries. In this regard, the Fed has a target on its back. Many critics see the central bank as too heavy handed in markets and too supportive of bad federal spending policies.

In retrospect, Trump’s campaign critiques of the Fed were really his attempt to discredit rising stock markets under a Democratic presidency. What we don’t know, though, is how sincere he was, or how interventionist he will become with current policy leaders. Will Trump clamp down on central bank powers? Will he cut short Yellen’s present term and seek a Fed leader with a different vision than the one we have?

In summary, the core economy always carries inertia into an election, and history shows that election outcomes don’t completely throw that off track. The fundamentals always matter, and current fundamentals show a modest but reaccelerating growth rate. Additionally, a return to positive corporate earnings strengthens the bullish case. The president eventually will exercise policy influencing markets; however for now, the inertia of the economy trumps Mr. Trump!


Christopher Riggs, J.D., CFP®, is the President of Alphalytics Research. To learn more about Alphalytics Research or the Economic Systemic Risk Index, please contact us at [email protected].

Amanda Adams
Fitness Expert
Lorem ipsum dolor sit amet, consectetur adipisicing elit. Totam assumenda, placeat ad. Consequatur ipsa asperiores corporis doloremque, dolore nihil blanditiis temporibus provident perspiciatis, iste officia voluptates nulla, ex veritatis harum.

2016: Following the Reacceleration Script

October 28th, 2016

Last January, in the morass of falling oil prices, dismal returns across both stocks and fixed income, slowing global growth, and climbing market pessimism, Alphalytics maintained high conviction that recession risk was not elevated and 2016 would see a reacceleration in the economy. Today’s GDP release of 2.9% is indeed evidence that 2016 is following the script to the reacceleration story.

“Turbulent Markets have participants wondering if we are on the cusp of a recession. However, a comprehensive assessment of the nine economic risk factors shows no historical precedence of recessionary risk under our present scores.
The question isn’t ‘Are we heading for a recession?’ Instead, market participants should be asking ‘When are temporary factors pulling down markets (like declining oil prices) going to wear off?’  When this is done, investors are going to find the economy is still expanding.”
Tracking the Business Cycle Report
January 26th, 2015

Objective metrics in January revealed that recession risk was unambiguously low and the U.S. growth engine was still intact. Likewise, history revealed oil prices were largely disconnected from the equilibrium price and were exercising a disproportionate negative influence on headline data. Furthermore, when oil prices eventually climbed, the likely scenario was they would then assist that same headline data back into positive territory.

Indeed, manufacturing data soon troughed and has slowly climbed since the first quarter. Retail sales and housing have remained steady and strong. As of today’s release, GDP is also revealing a lift in aggregate activity while being led by personal consumption. The next act is for corporate earnings to participate.

Looking ahead, the latest data from FactSet shows S&P 500 earnings growth at 5.5%, while Thompson Reuters shows the first and second quarters of 2017 at low double digit growth. Much has been made about the five consecutive quarters of negative earnings across the S&P through Q2 of 2016. However, the worst is now behind us and the case for an upward earnings trajectory for the next three quarters is compelling.

History shows that stock investors have been handsomely rewarded when moving from periods of declining earnings to periods of rising earnings. While no period is exactly like the past, it would be highly inconsistent for stock investors to turn a blind eye toward an improving corporate outlook.


Christopher Riggs, J.D., CFP®, is the President of Alphalytics Research. To learn more about Alphalytics Research or the Economic Systemic Risk Index, please contact us at [email protected].

Amanda Adams
Fitness Expert
Lorem ipsum dolor sit amet, consectetur adipisicing elit. Totam assumenda, placeat ad. Consequatur ipsa asperiores corporis doloremque, dolore nihil blanditiis temporibus provident perspiciatis, iste officia voluptates nulla, ex veritatis harum.

Alphalytics Research Releases Record of First Year

September 6th, 2016

In recognition of a full year passing since the formal launch of Alphalytics Research in the summer of 2015, a condensed record has been compiled of the analysis and insight that subscribers have been receiving. The infographic below highlights the major market and economic events of the past year in addition to specific quotes or topics from Alphalytics Research materials that have been released. For questions or to gain access to a complimentary evaluation of our research, please contact us here.


click for full size graphic
Amanda Adams
Fitness Expert
Lorem ipsum dolor sit amet, consectetur adipisicing elit. Totam assumenda, placeat ad. Consequatur ipsa asperiores corporis doloremque, dolore nihil blanditiis temporibus provident perspiciatis, iste officia voluptates nulla, ex veritatis harum.

Coming to Grips with a Low Growth GDP Era

Let’s face it, we live in a low growth world. The days of 3% and 4% GDP growth rates are long gone. Most of the explanation is purely demographic. Low birth rates mean low workforce growth. Even more, greater portions of the population are spending on fixed budgets as waves of boomers turn 65.

So, when the U.S. reports a real GDP quarterly growth rate like last week’s +0.5%, the reactions are interesting.  Here are some quick observations.

     1. Low growth quarters like last week’s release are “Normal” by the statistical definition of the word.

Chart 1 below shows the 10 year average of quarterly GDP growth wrapped by a one standard deviation metric in the shaded blue area. From a quick glance, one easily can see the longstanding run rate of 3%-4% growth from the 1960s to 2007. One can also see the downshift in average GDP after the last recession.

Take a deep look and one can see where the blue area has dipped below zero on the downside of the average. This conveys that sub 1% growth rates like the 1st quarter of 2016 fall well within the statistical boundaries of normal variance.

Chart 1

Chart 1


     2. Sub 1% growth is no longer a bellwether signal that a recession is following.

In prior decades, higher average growth rates meant that a low GDP quarter like last quarter likely foretold of an ominous end to the expansion. Chart 2 (below) layers actual quarterly GDP over the shaded area of normal distribution.  For the most part, GDP growth stayed tremendously buoyant during expansions, rarely dropping below 1% growth.

In contrast, GDP prints at or below 1% typically preceded or coincided with recessionary starts.

Today’s low growth world is far different. If the current 1st quarter growth figure holds up after revisions, it would mark the seventh sub 1% growth quarter in the last 21 quarters.

Chart 2

Chart 2


In conclusion

I get it, it’s a common question, “How can markets keep going up when U.S. growth is so lousy?”

However, investors who get overly caught up on the structural issues of growth are missing the point.

It is not the rate of growth compared to prior decades that matters most, it is the resilient growth the U.S. is demonstrating compared to its weaker developed market peers.

Furthermore, as long as the growth ingredients remain intact – interest rates, low inflation, improving employment, capital investment – then growth will likely persist. And, in the end, the evidence remains clear: growing economies support expanding markets.

Christopher Riggs, J.D., CFP®, is the President of Alphalytics Research. To learn more about Alphalytics Research or the Economic Systemic Risk Index, please contact us at [email protected].

Amanda Adams
Fitness Expert
Lorem ipsum dolor sit amet, consectetur adipisicing elit. Totam assumenda, placeat ad. Consequatur ipsa asperiores corporis doloremque, dolore nihil blanditiis temporibus provident perspiciatis, iste officia voluptates nulla, ex veritatis harum.

Comments