No, Soft Manufacturing is Not Flagging a Recession
As markets have floundered over the last year, more voices have spoken out regarding the threat of a recession. One area used to support this case points to the soft manufacturing data, especially as revealed in the ISM report. In the following, we’ll expound on why the ISM and other manufacturing data has a lot more to the story than meets the eye.
The Headline Numbers
Noted for its usefulness as a leading economic indicator, the Manufacturing ISM® Report on Business® is a diffusion index based on survey data of more than 300 purchasing and supply executives from across the country. A simple reading interprets scores of 50 or higher with an expanding manufacturing sector, while a score below 50 indicates sector contraction.
The November 2015 ISM composite score registered a level of 48.6, immediately setting off the whistles of major media outlets. The December reading declined to 48.2, still in contraction territory and furthering the alarms for a pending recession.
History as a Guide
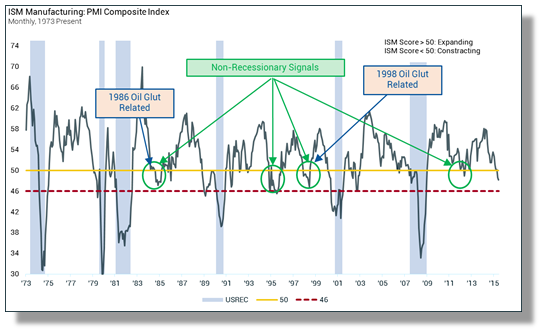
The long term history of the ISM Manufacturing score has shown it to be necessary but not sufficient for flagging recessions. This means that low scores have preceded every recession since 1974 (See Chart 1), but at times there have been false signals as well (See Chart 2).
Chart 1
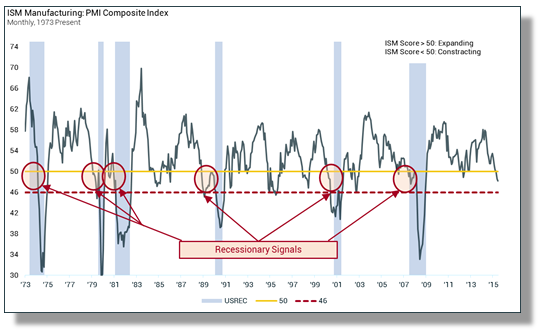
Chart 2
More to the Story
Unpacking the false signals illuminates our present situation. There have been two oil supply gluts that offer legitimate comparisons to what is taking place today with oil. In 1986, crude prices fell more than -66% from 1985 highs. This was a true supply glut. Oil had maintained prices above $30/barrel for six years. Prices stabilized in the low teens and stayed low for more or less a decade. In 1998, crude prices fell another -60% after a battle between OPEC nations led to a supply glut.
In both instances the ISM manufacturing scores dipped below 50, yet the economy avoided a recession. The connecting point lies in the little known fact that petroleum is one the largest manufacturing sub-sectors. While most people think of manufactured goods as “widgets,” the industry data includes petroleum exploration and processing as a manufactured “good.”
Another interesting connecting point lies in this fact: in both instances the soft ISM Manufacturing score bottomed out in the same month that oil prices troughed.
When one actually reads the ISM Report on Business you see that, of the major sub-sectors, petroleum has been the persistent detractor over the last year.
The Widespread Effect of Declining Oil Prices
The same effect seen in the ISM report is also showing up in other highly publicized data points. The Manufacturer’s Shipments, Inventories, and Orders Survey, the Industrial Production Index, and even Retail Sales are all showing depressed figures due to the pervasive impact of oil. When one excludes the oil component from the headline figures, all of the data show a healthier economy than what most are perceiving.
Let Me Leave You with This
Our own threshold for identifying real trouble on the ISM index is when scores fall below 46 (see charts). If that occurs, the outlook would change altogether.
Absent a dip below 46, there is a clear case that a lot more commerce is taking place than what is being measured because of the impact of declining oil. As oil prices retrace the lows of the past year, there could likewise be an upward pull in the data. Again, referencing 1986 and 1998, once oil established a bottom the ISM data quickly rebounded into the high 50’s within ten months. While no situation is exactly the same as the past, one should be factoring this into the outlook as the year unfolds.
For more information about the Alphalytics Research Economic Systemic Risk Index, or to inquire about a subscription please email [email protected].