High Yield Check-in: What the Analytics Say
December 30th, 2016
A year ago, in the midst of severe distress in High Yield fixed income, a research bulletin was published for subscribers titled “Seven Salient Thoughts on High Yield Now” (December 17, 2015) whereby we outlined the following assessment:
- High Yield distress was primarily attributed to investor fear of oil-related defaults.
- Oil prices (and those of high yield debt) were oversold.
- When oil prices retraced back toward equilibrium, High Yield would see a snap-back rally.
Indeed, the High Yield sell-off bottomed on the same day as oil prices on February 11th. Currently, at the close of 2016, the median Morningstar High Yield fund is up more than 13%.
But what is to be expected now? Can the run still continue? The summary below offers a quick example at how analytics can help drive allocation decisions.
Examining Periods with Low Spreads
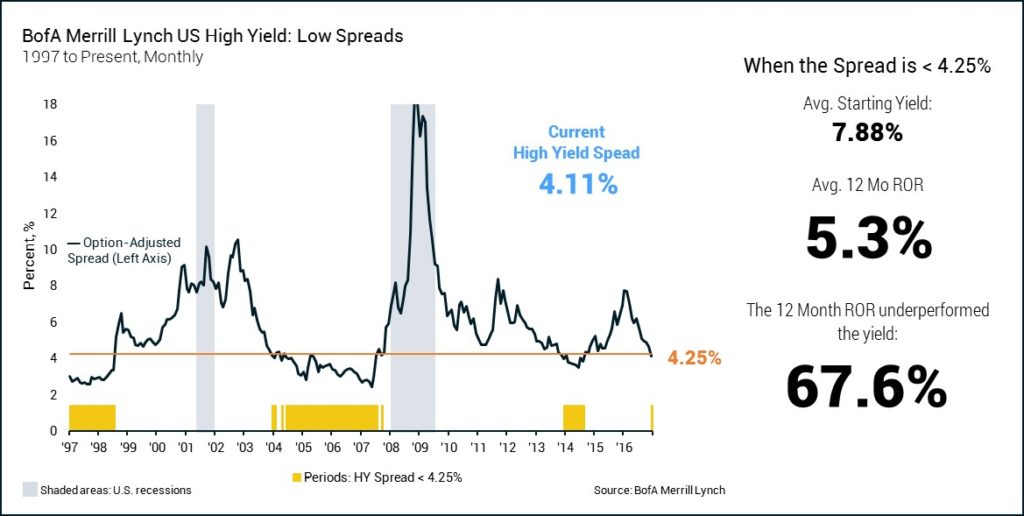
The present rally has pushed spreads (BofA Merrill Lynch US High Yield Option-Adjusted Spread) back down to low levels not seen since 2014. When looking at periods with similarly low spreads (<4.25%), here is what the data says:
- Periods of low spreads (marked by the yellow periods) are not that uncommon, making up 29% of the time over the last 20 years.
- Nonetheless, the average 12 month return is only 5.3%. While that may seem satisfactory at first, remember some important points. First, it’s actually less than the average starting yield, meaning the return under-performed the yield investors were hoping to attain. Secondly, it is without a packaged fund expenses which would also bring down the realized return.
How Cycle Staging Can Contribute to the Assessment
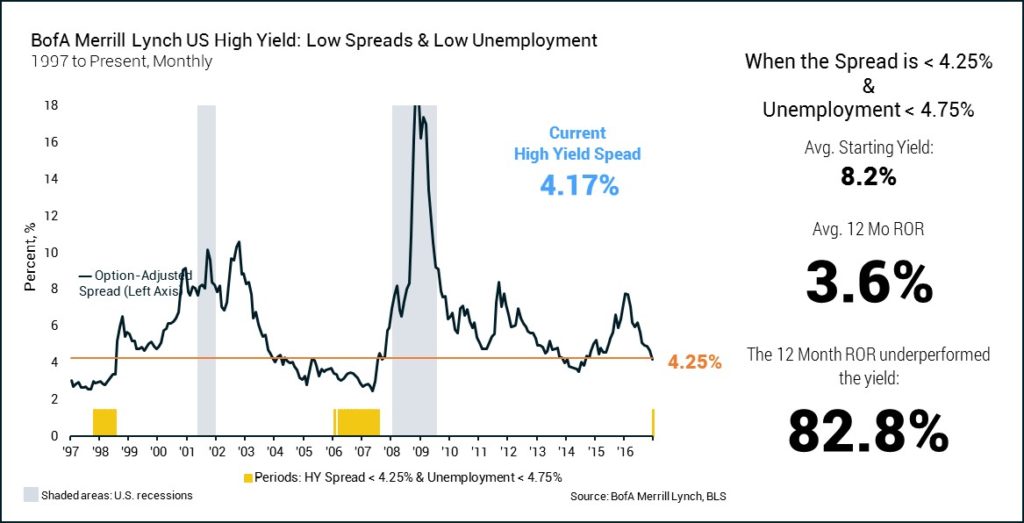
Adding a second criteria where the examination looks only at those periods with low spreads and low unemployment (at < 4.75%, it serves as a proxy for late cycle staging) further develops the outlook for High Yield.
- Periods meeting both criteria are much less common, making up only 11% of the 20-year snapshot.
- When considering late stage investing, the average return worsens (as expected), producing a 3.6% 12 month return.
- The 3.6% return certainly doesn’t compensate investors for the perceived risk they take when investing in High Yield, nor does it meet the desired target return when serving as an anchor to an income based portfolio.
What to Conclude from the Analytics
Combining business cycle staging, historical asset class performance, and sound analytics, offers a deeper understanding of the evolving risk/reward profile of High Yield fixed income. Unfortunately, present circumstances show High Yield with diminishing upside potential and an expanding downside. This evolving outlook warrants caution for investors in 2017 and a close reexamination of expectations. At a minimum, investors would be wise to avoid untimely over-weighting an asset class after its’ driving forces have dissipated.
Of course, proper analytics does require acknowledging that a poor return isn’t imminent. There have been occasions upon which spreads started low in the late stage and attractive returns still followed. In order for this to occur, corporate lending distress must recede further and investors must be willing to pay higher prices for a lower overall effective yield. While not completely out of the range of possibilities, each of these events become less likely as the expansion matures.
Christopher Riggs, J.D., CFP®, is the President of Alphalytics Research. To learn more about Alphalytics Research or the Economic Systemic Risk Index, please contact us at [email protected].

