Deconstructing a Historically Flat Market
The notoriously flat equity market of 2015 has baffled investors, and thus, heightened nerves for many. Indeed, the lackluster nature of this market is one of historical proportions.
So far this year, the S&P 500 index and the DJIA have both recorded positive returns for the 1st and 2nd quarters. However, each returned less than 1% per quarter. The last time this occurred in the DJIA for consecutive quarters was 1904!
We can measure the breadth of movement by looking at the S&P 500’s Bollinger Band width. This tells us how wide the variance has been in recent market movement. Again, this is the tightest width since 1994.
It is notable that the S&P 500 index has had no declines worse than 5% since last October, more than nine months ago!
A Deeper Look Reveals Winners and Losers.
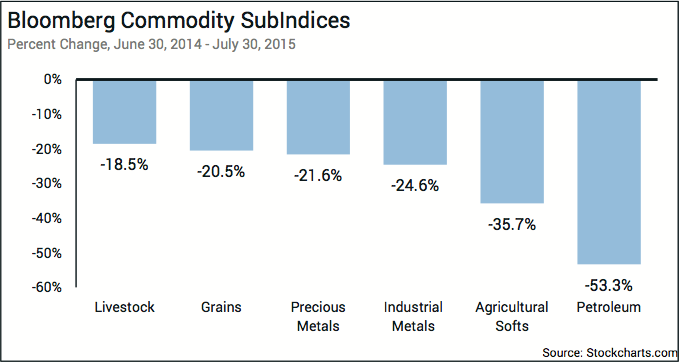
1. The Commodity Plunge.
A large proportion of the sideways market action is explained by the sector bifurcation caused by collapsing commodity prices.
While oil captured most the headlines, few noticed the commodity plunge was really very broad (see chart below) and extended well beyond oil.
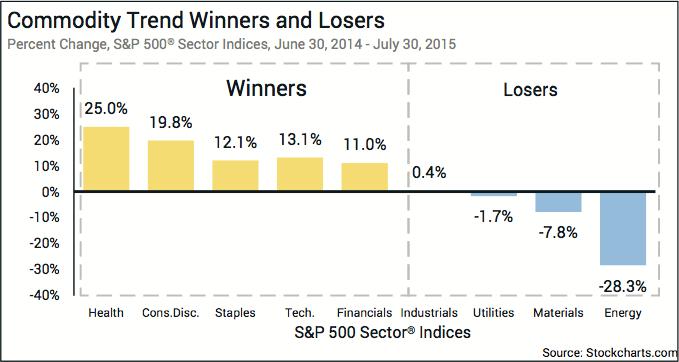
2. Big Commodity Pricing Changes Impact Company Revenues.
Commodity prices have a major impact of the revenues of certain stock sectors. In some ways, the corporate revenues in the energy, materials, and utilities sectors are simple pass-through vehicles for the commodities they deal in.
Furthermore, other sectors are impacted by the changing input cost that is a natural by-product of commodity price movement. In this case, there have been many beneficiaries to the commodity pricing plunge (see chart 2 below).
3. Not an overall Bad Market, but a Market of Good and Bad.
Whether your last year of investing has been productive is really an outgrowth of where and how you were invested. For the right sector rotation strategies, there have been some beautiful returns. For broad based strategies, the last year has felt like a tie. For those with exposures to natural resources, hard assets, and commodities, you are likely feeling the pain.
Finally, how long can this be expected to keep up?
That is a terrific question, and one that begs the evaluation of causality for the commodity collapse (and it certainly goes beyond the fracking success in oil.)
Certainly, the U.S. dollar strengthening trend has contributed to the commodity price fallout. While on pause for now, there is a case that central bank activity will cause the dollar strengthening trend to resume and carry on for some time to come.
While demand in the developed world weakened last year, it was only at modest levels and is beginning to pick back up.
Lastly, there is China. Years of excessive capital investment pulled commodity prices up. But now, with signs of China slowing, the evidence suggest there may be an overcapacity problem in commodity suppliers.
One unique thing about commodity prices is the idea of a conceptual bottom – that place where producers simply can’t function. As of now, we are obviously closer to a bottom than a year ago. However, finding a bottom is not the same thing as prices reversing and going back up. It is likely that low prices are here to stay for a very long while.